Performance analytics
Purpose
The Performance page (Dashboard → Performance in the sidebar) is the deep
analytics view of everything your accounts have traded — far beyond the
Dashboard’s summary. Use it to answer questions like which symbol loses money,
what hours my bot trades best, and how much of my P&L is robot versus manual.
Prerequisites
- At least one linked MT5 account with synced history (see Link an MT5 account).
- History sync completed for the range you want to analyze — while the 90-day backfill is running, older ranges are thin. Watch the sync chip in the top bar (see The Senti interface).
Step-by-step
Scope what you are analyzing
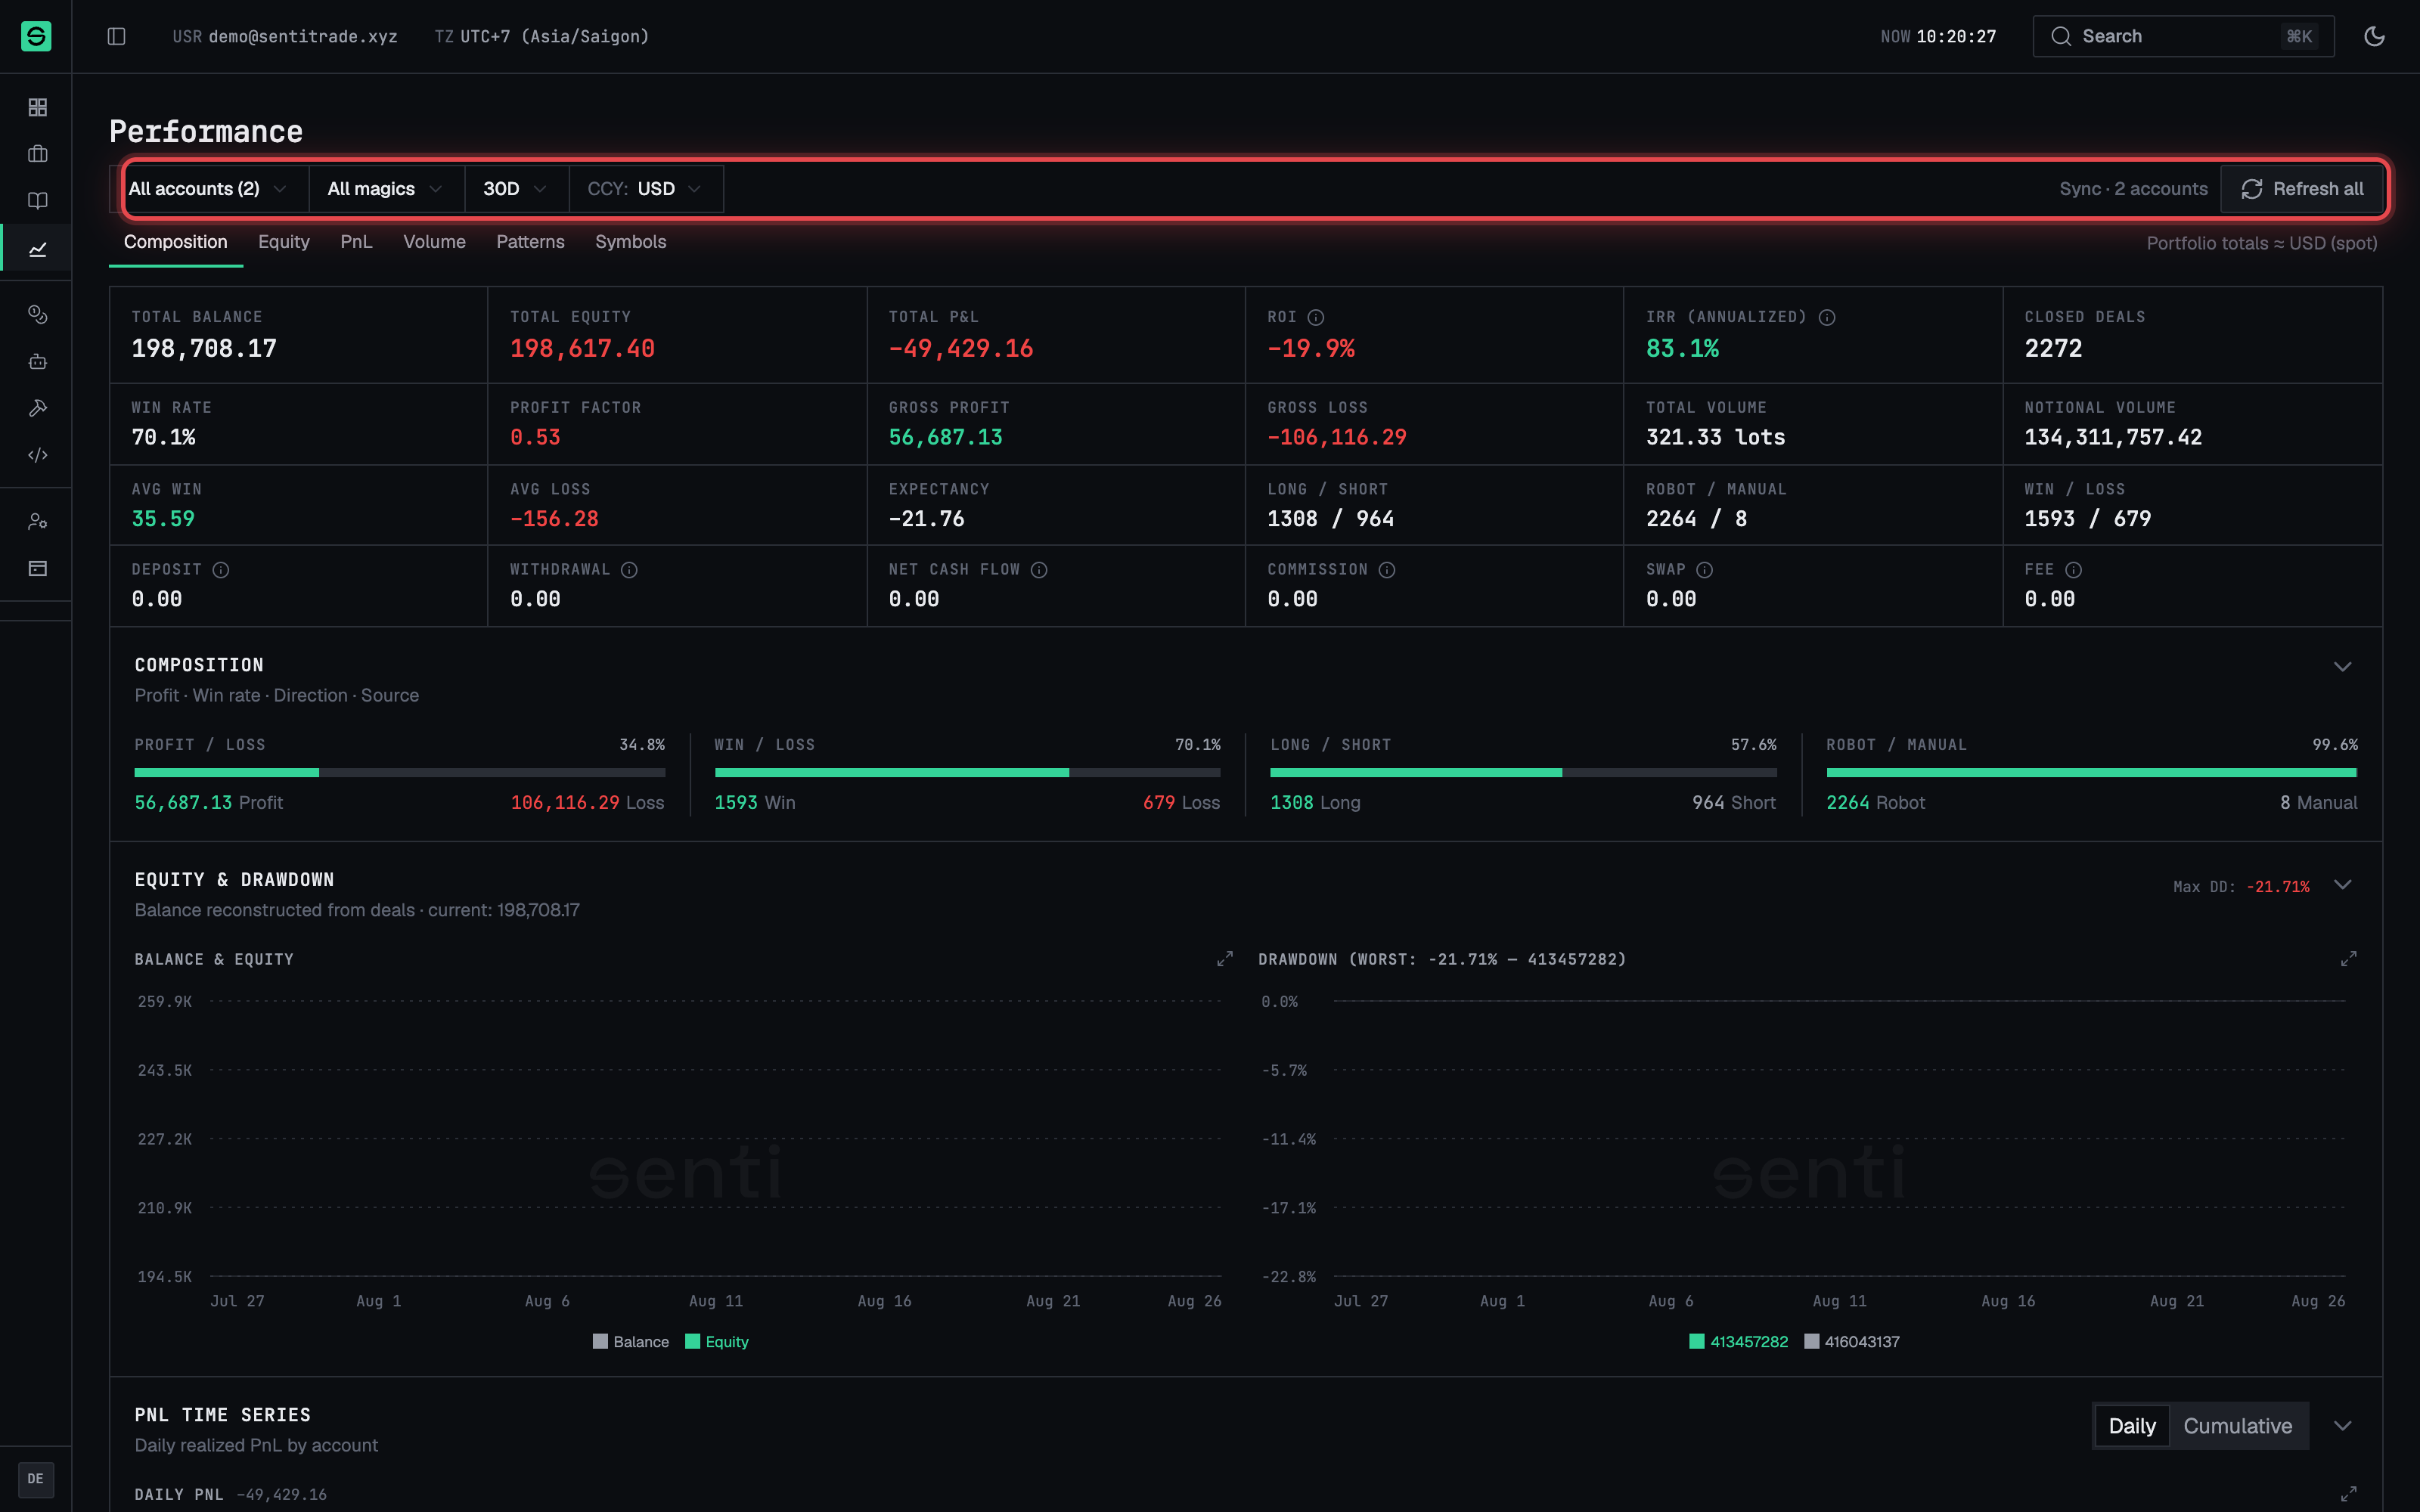
- Open the filter bar. At the top of the page, choose the accounts to include, the date range (or a preset), the reporting currency, and optionally a single symbol.
- Narrow to one bot if needed. The bot / magic-number scope filter limits every KPI and chart below to trades placed by that deployment — the cleanest way to judge a single EA.
- Export if you need the data elsewhere. Use Export on the filter bar.
Read the KPIs
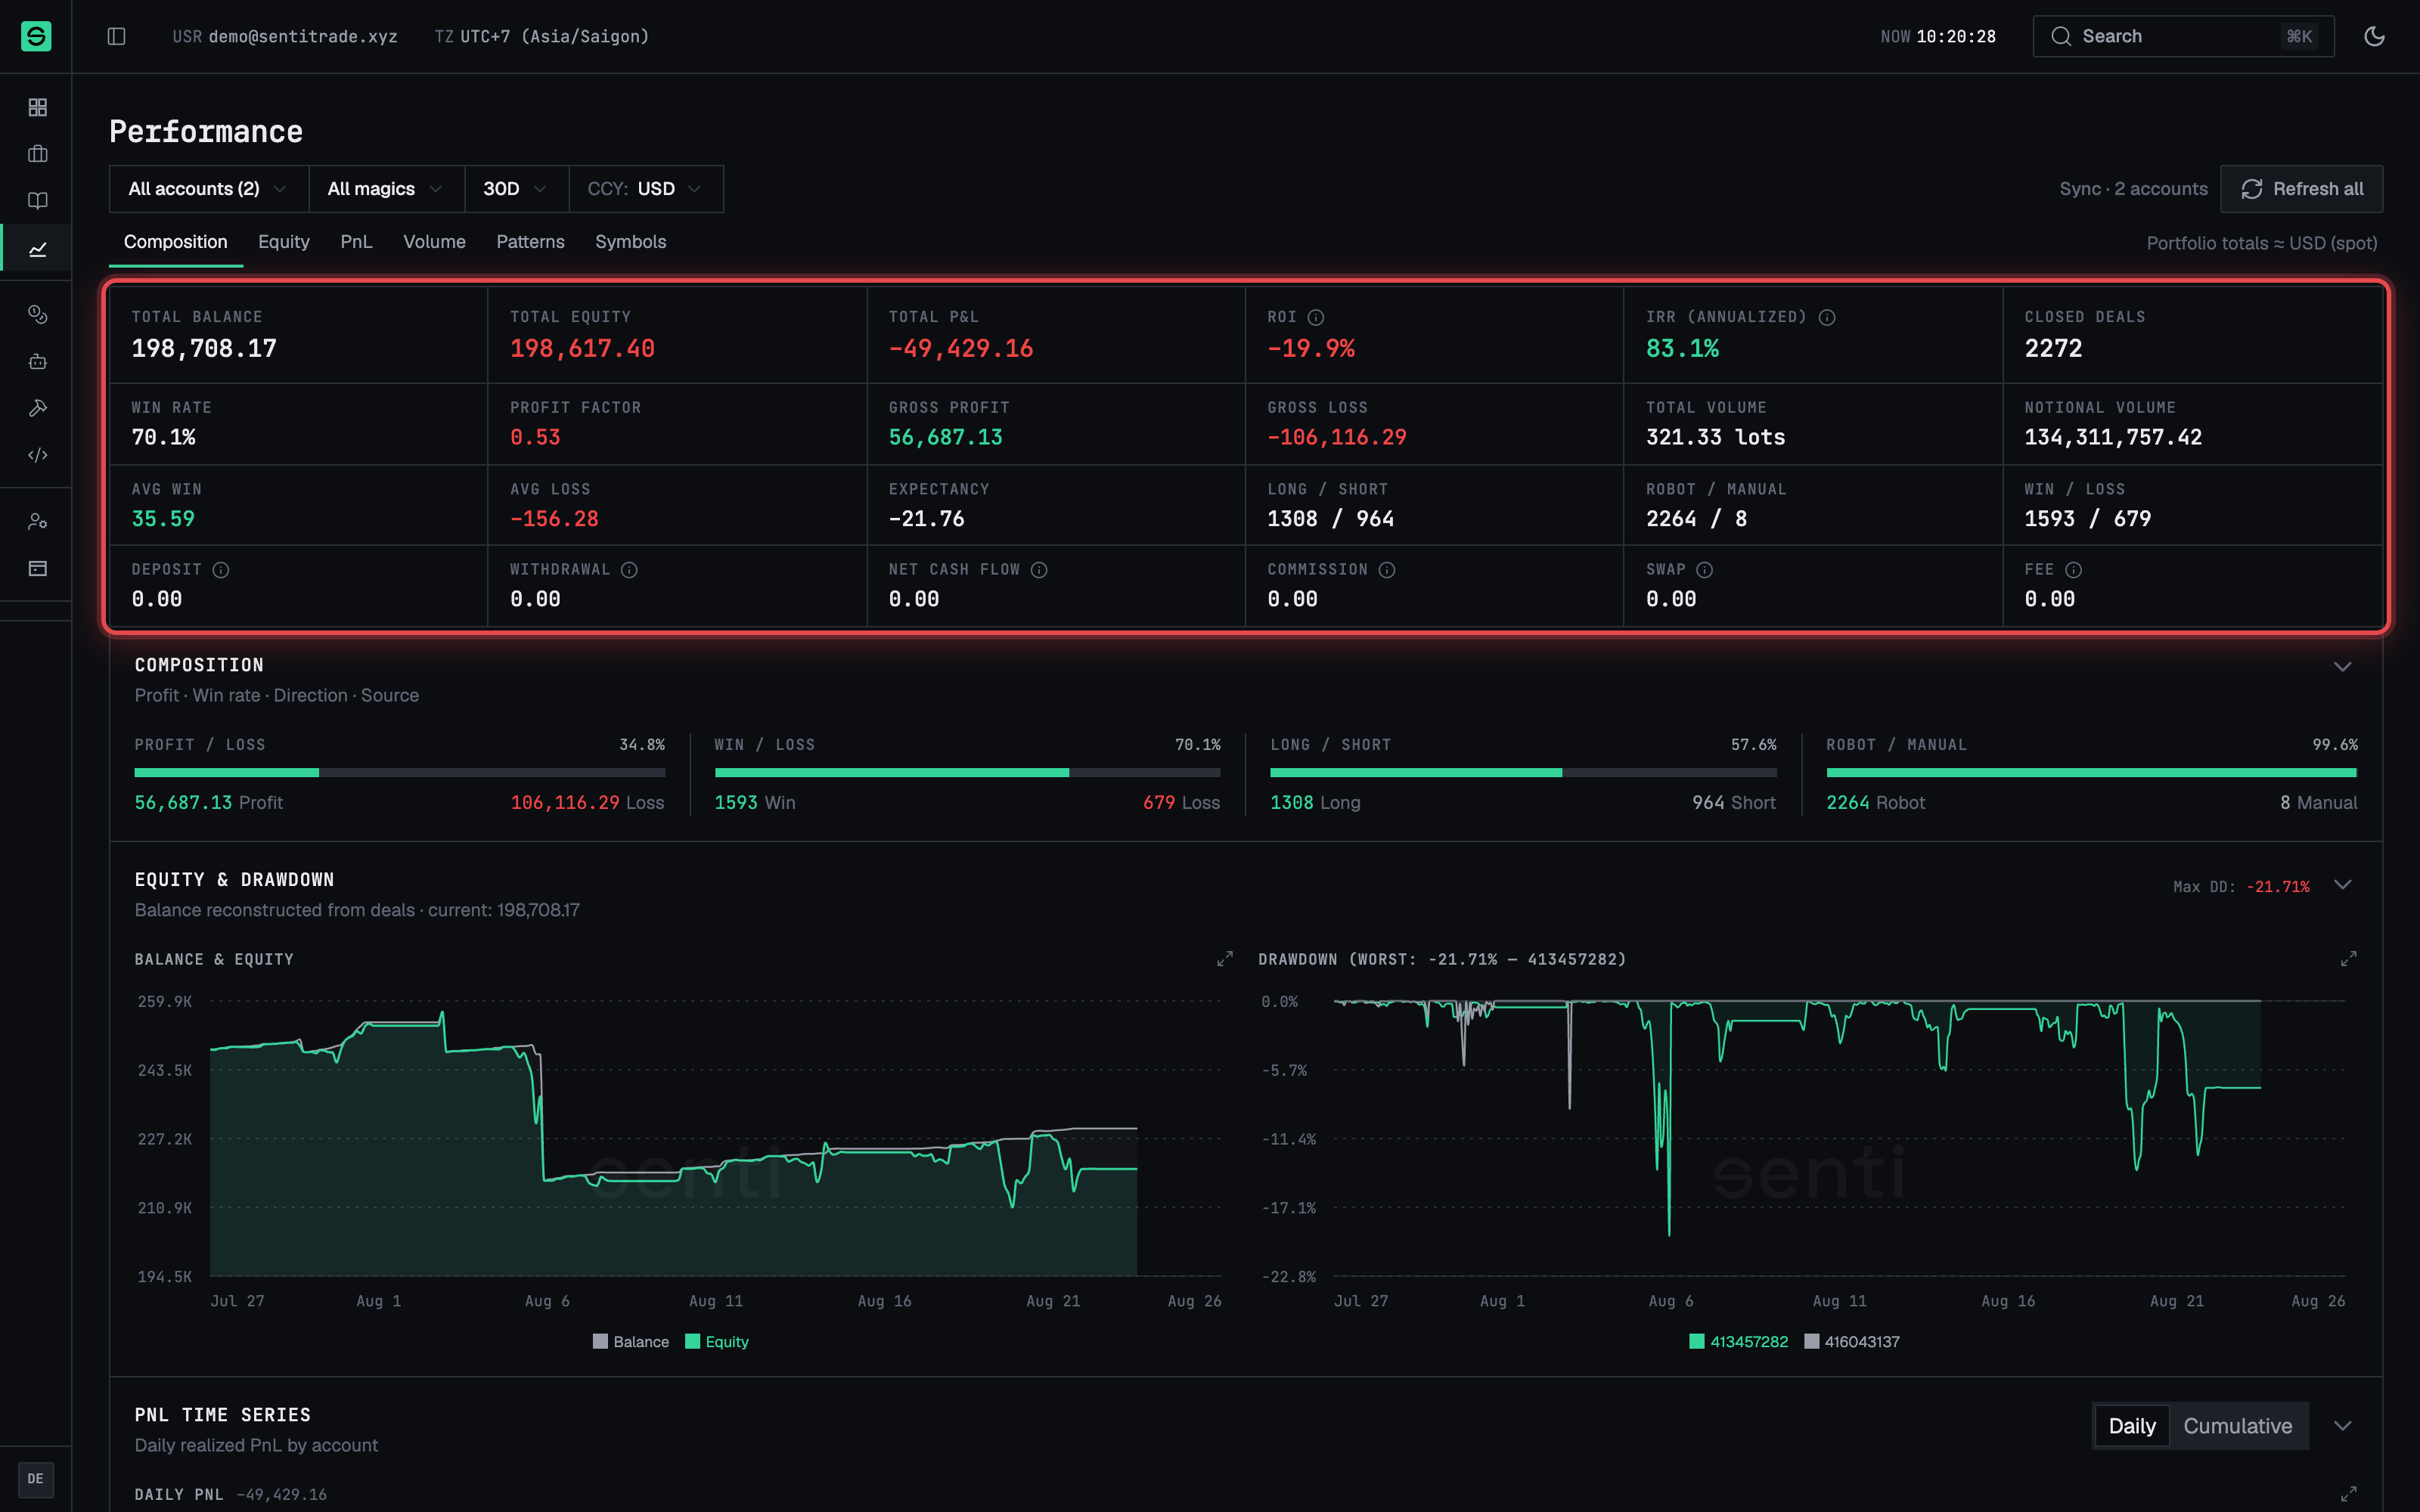
- Scan the KPI grid. Around thirty measures are computed for the current scope, including ROI, profit factor, expectancy, gross profit/loss, commission, swap, fees, deposits and withdrawals, notional volume, long/short split, robot-vs-manual split, and win/loss counts.
Read the charts
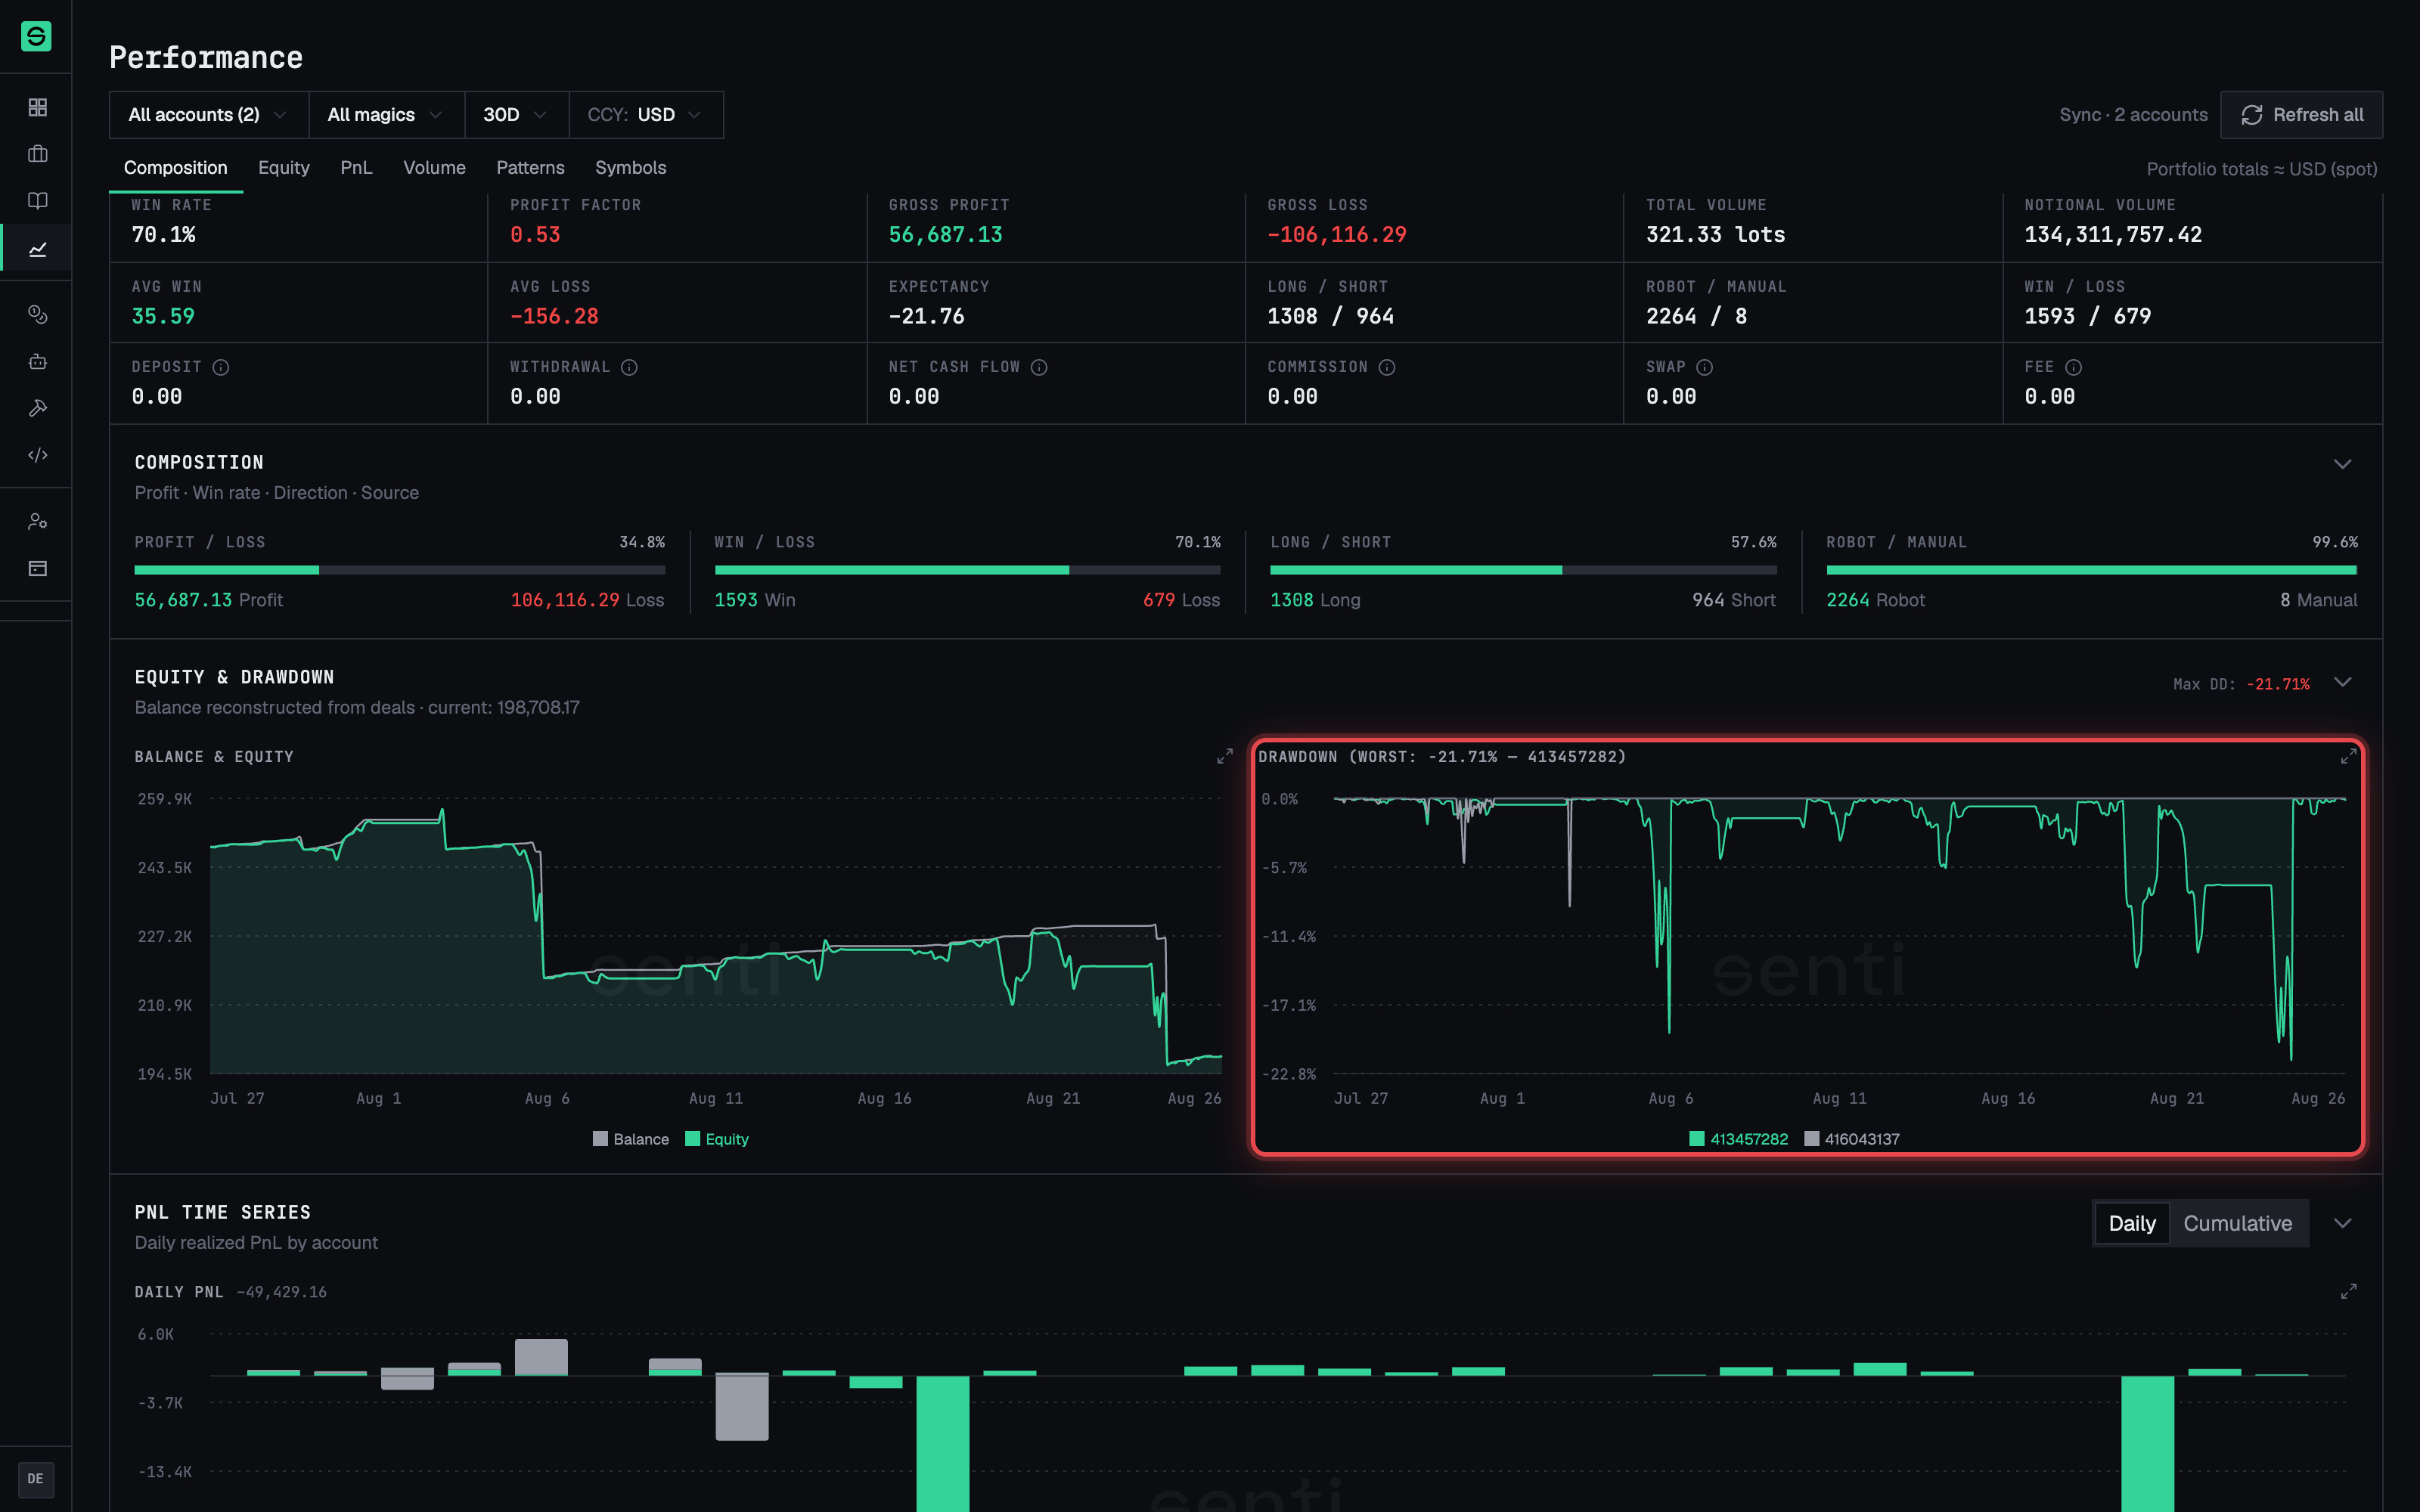
- Work down the chart stack. Balance/equity (including mark-to-market), daily and cumulative P&L, P&L by symbol, deals by symbol, volume in lots and notional USD, drawdown, win rate, long-vs-short, profit-vs-loss, and robot-vs-manual composition.
- Use the hourly heatmaps. The P&L heatmap and the trade-count heatmap are bucketed by hour in broker time — the fastest way to see when a strategy actually earns.
Check per-account status
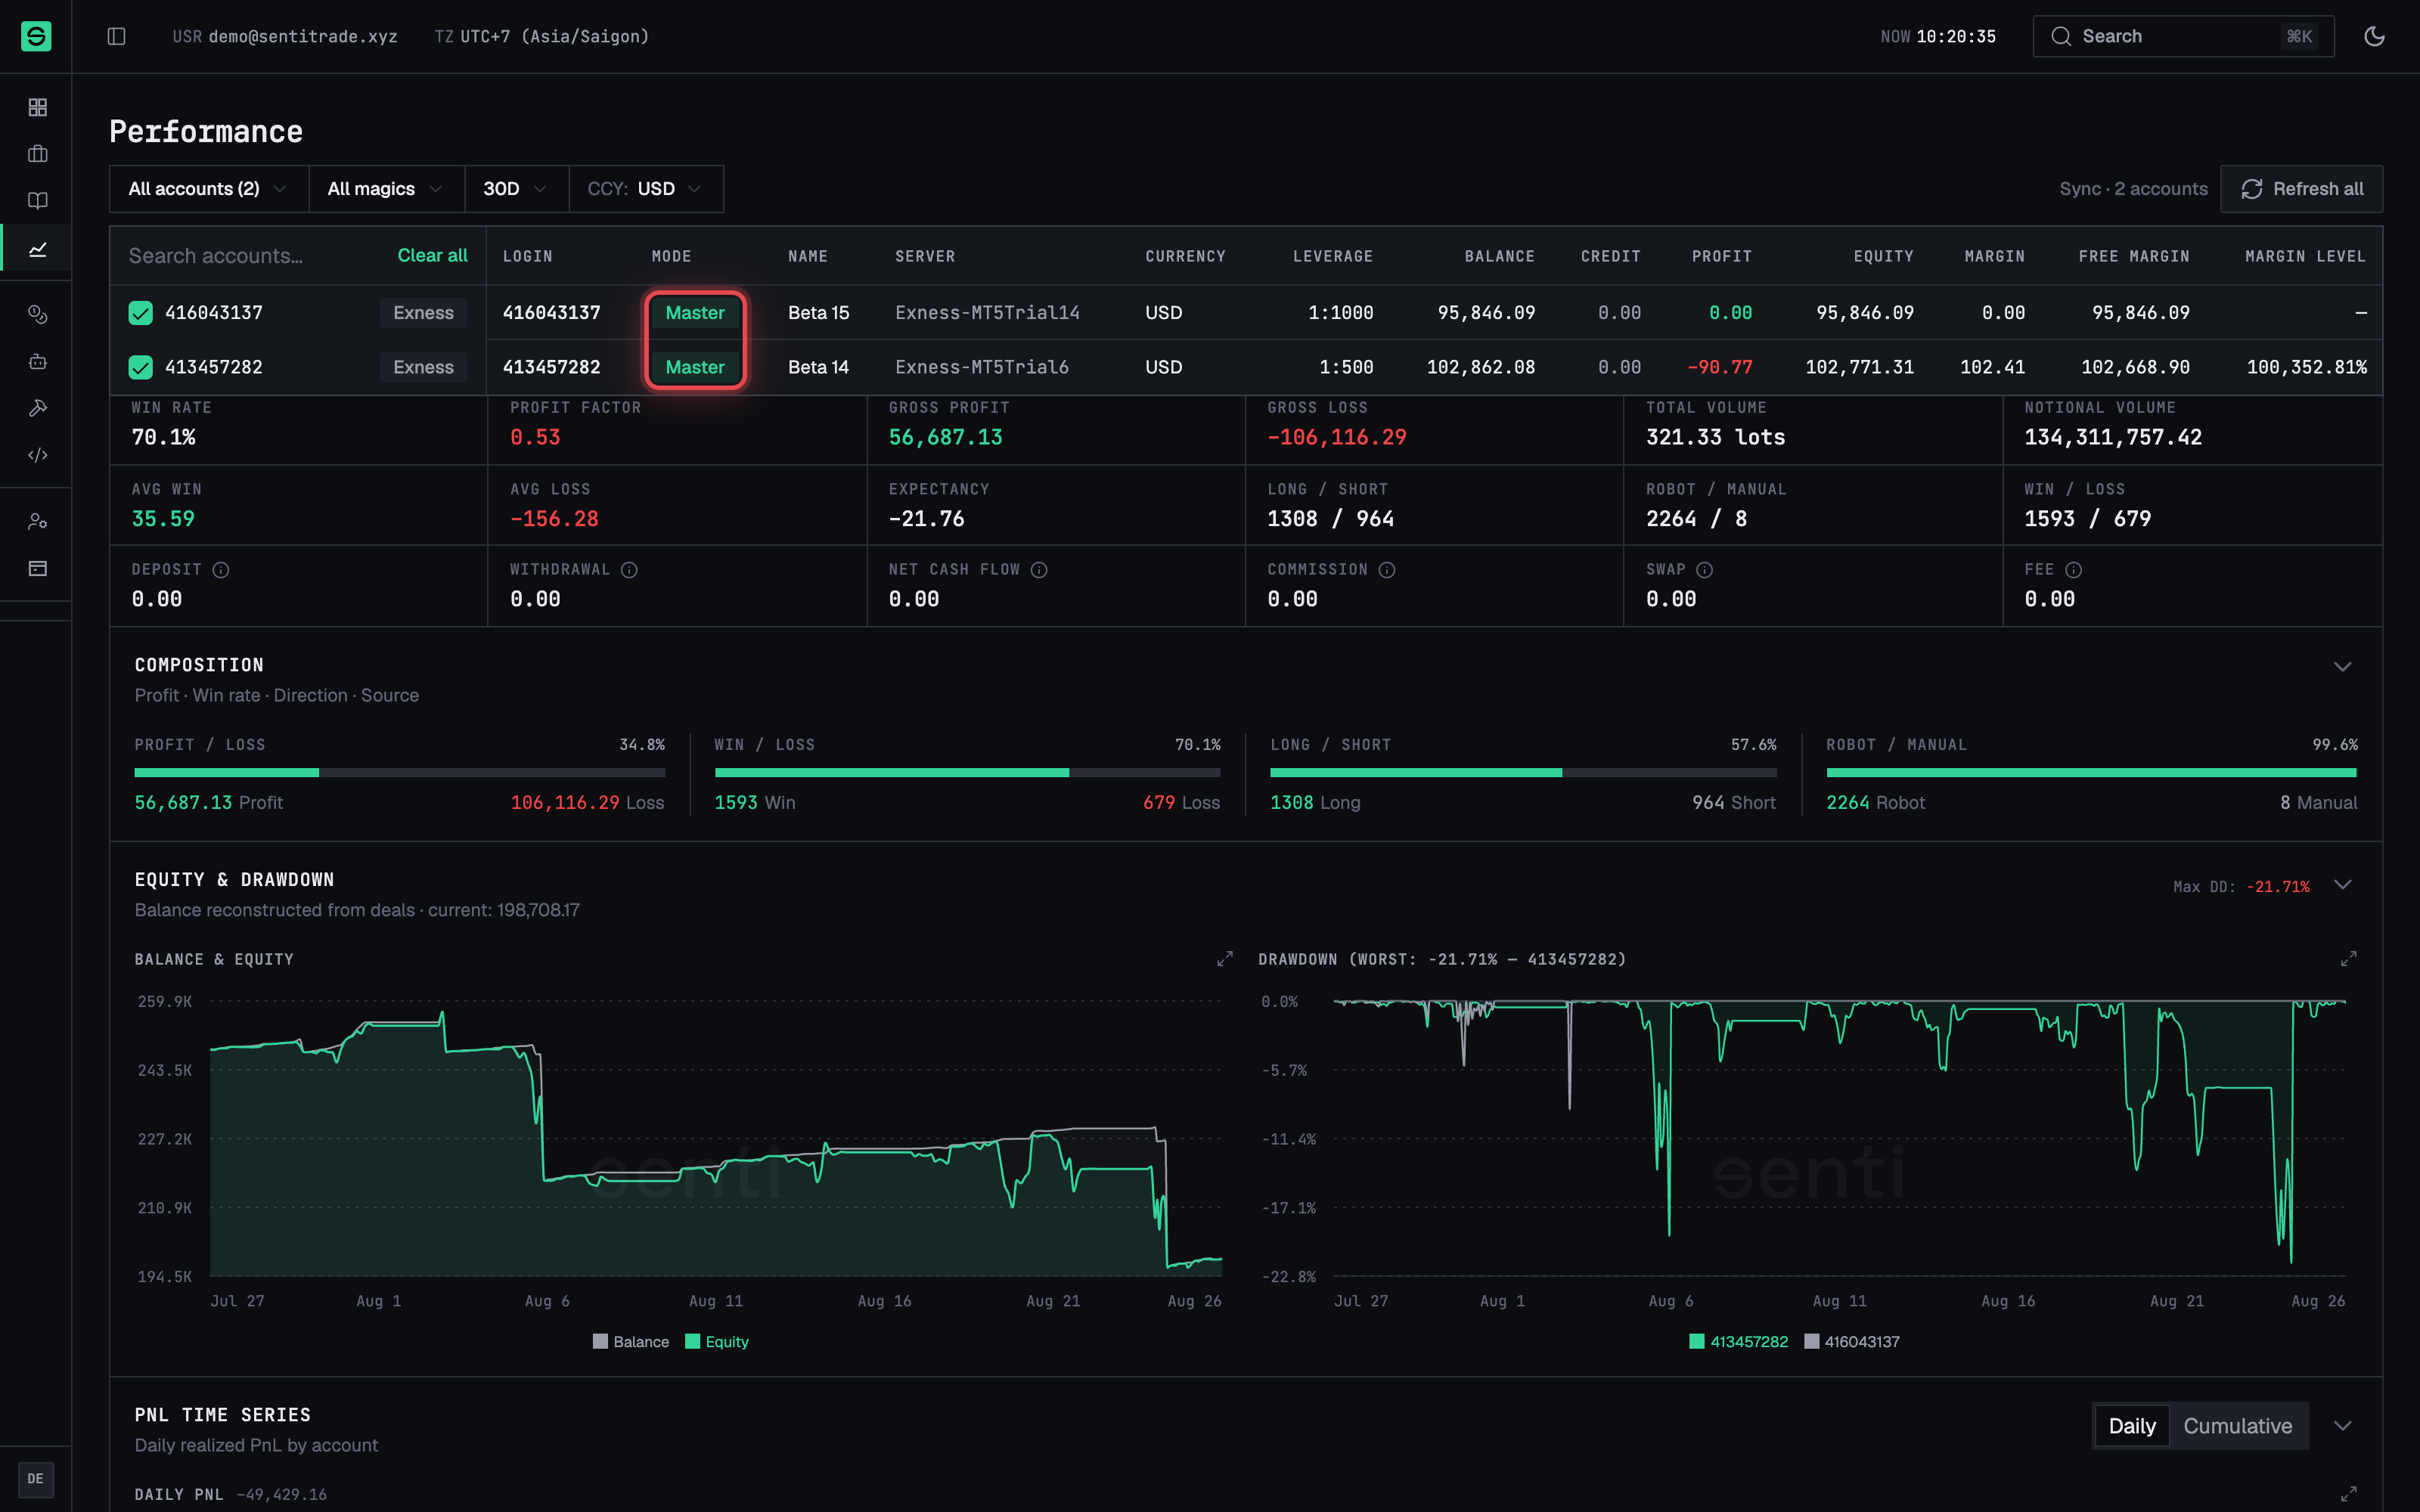
- Review the account table. Each row shows the account’s access badge (Master, View only, or Detecting), an offline flag, leverage, and margin level.
Warnings & constraints
⚠️ Broker time, not your time. The hourly heatmaps use the broker’s timezone. Before acting on an “hour of day” pattern, convert to your local time.
Note. Multi-currency portfolios are converted to the reporting currency using FX rates. If a rate is stale or an account cannot be converted, the page flags it — those accounts are excluded from converted totals rather than silently mixed in.
- The Dashboard and this page draw from the same warehouse and are kept in parity; small differences against your MT5 terminal reflect the historical path’s cache lag (up to ~5 minutes).
- View-only accounts appear in analytics like any other — the badge only restricts trading, not reporting.
Common errors
| Symptom | Cause | Fix |
|---|---|---|
| No data in range | The selected range has no closed deals | Widen the date range or clear the symbol filter |
| A “not currency-converted” badge on totals | An account’s currency has no usable FX rate | Totals exclude that account; check the per-account rows instead |
| KPIs differ from the Dashboard | Different scope (accounts/range) selected on each page | Align the filters — with identical scope the pages are in parity |
| Charts lag what your terminal shows | Historical path cache (up to ~5 min) | Press Refresh on the sync chip and re-check |
| A bot-scoped view shows almost no trades | Wrong magic-number/bot selected | Re-pick the deployment in the bot scope filter |