The Dashboard
Purpose
The Dashboard is the portfolio-level home screen. It rolls every linked MT5 account into one FX-normalized view: total portfolio value, realized and floating P&L, an equity curve, a KPI grid, your top accounts, and the latest trading activity. Use it for the daily “is everything OK?” check; for deep analysis, go to Performance analytics.
Prerequisites
- A signed-in Senti account.
- At least one linked MT5 account. With none, the Dashboard shows “Link an MT5 account to see live data.” — see Link an MT5 account.
Step-by-step
Read the portfolio hero
-
Check the headline number. Total portfolio (shown with your reporting currency, e.g. Total portfolio · USD) is the FX-normalized sum of your accounts. Next to it, a freshness tag reads live when data is current or as of {time} when it is a snapshot. If some accounts could not be converted, a badge counts “{count} accounts not currency-converted”.
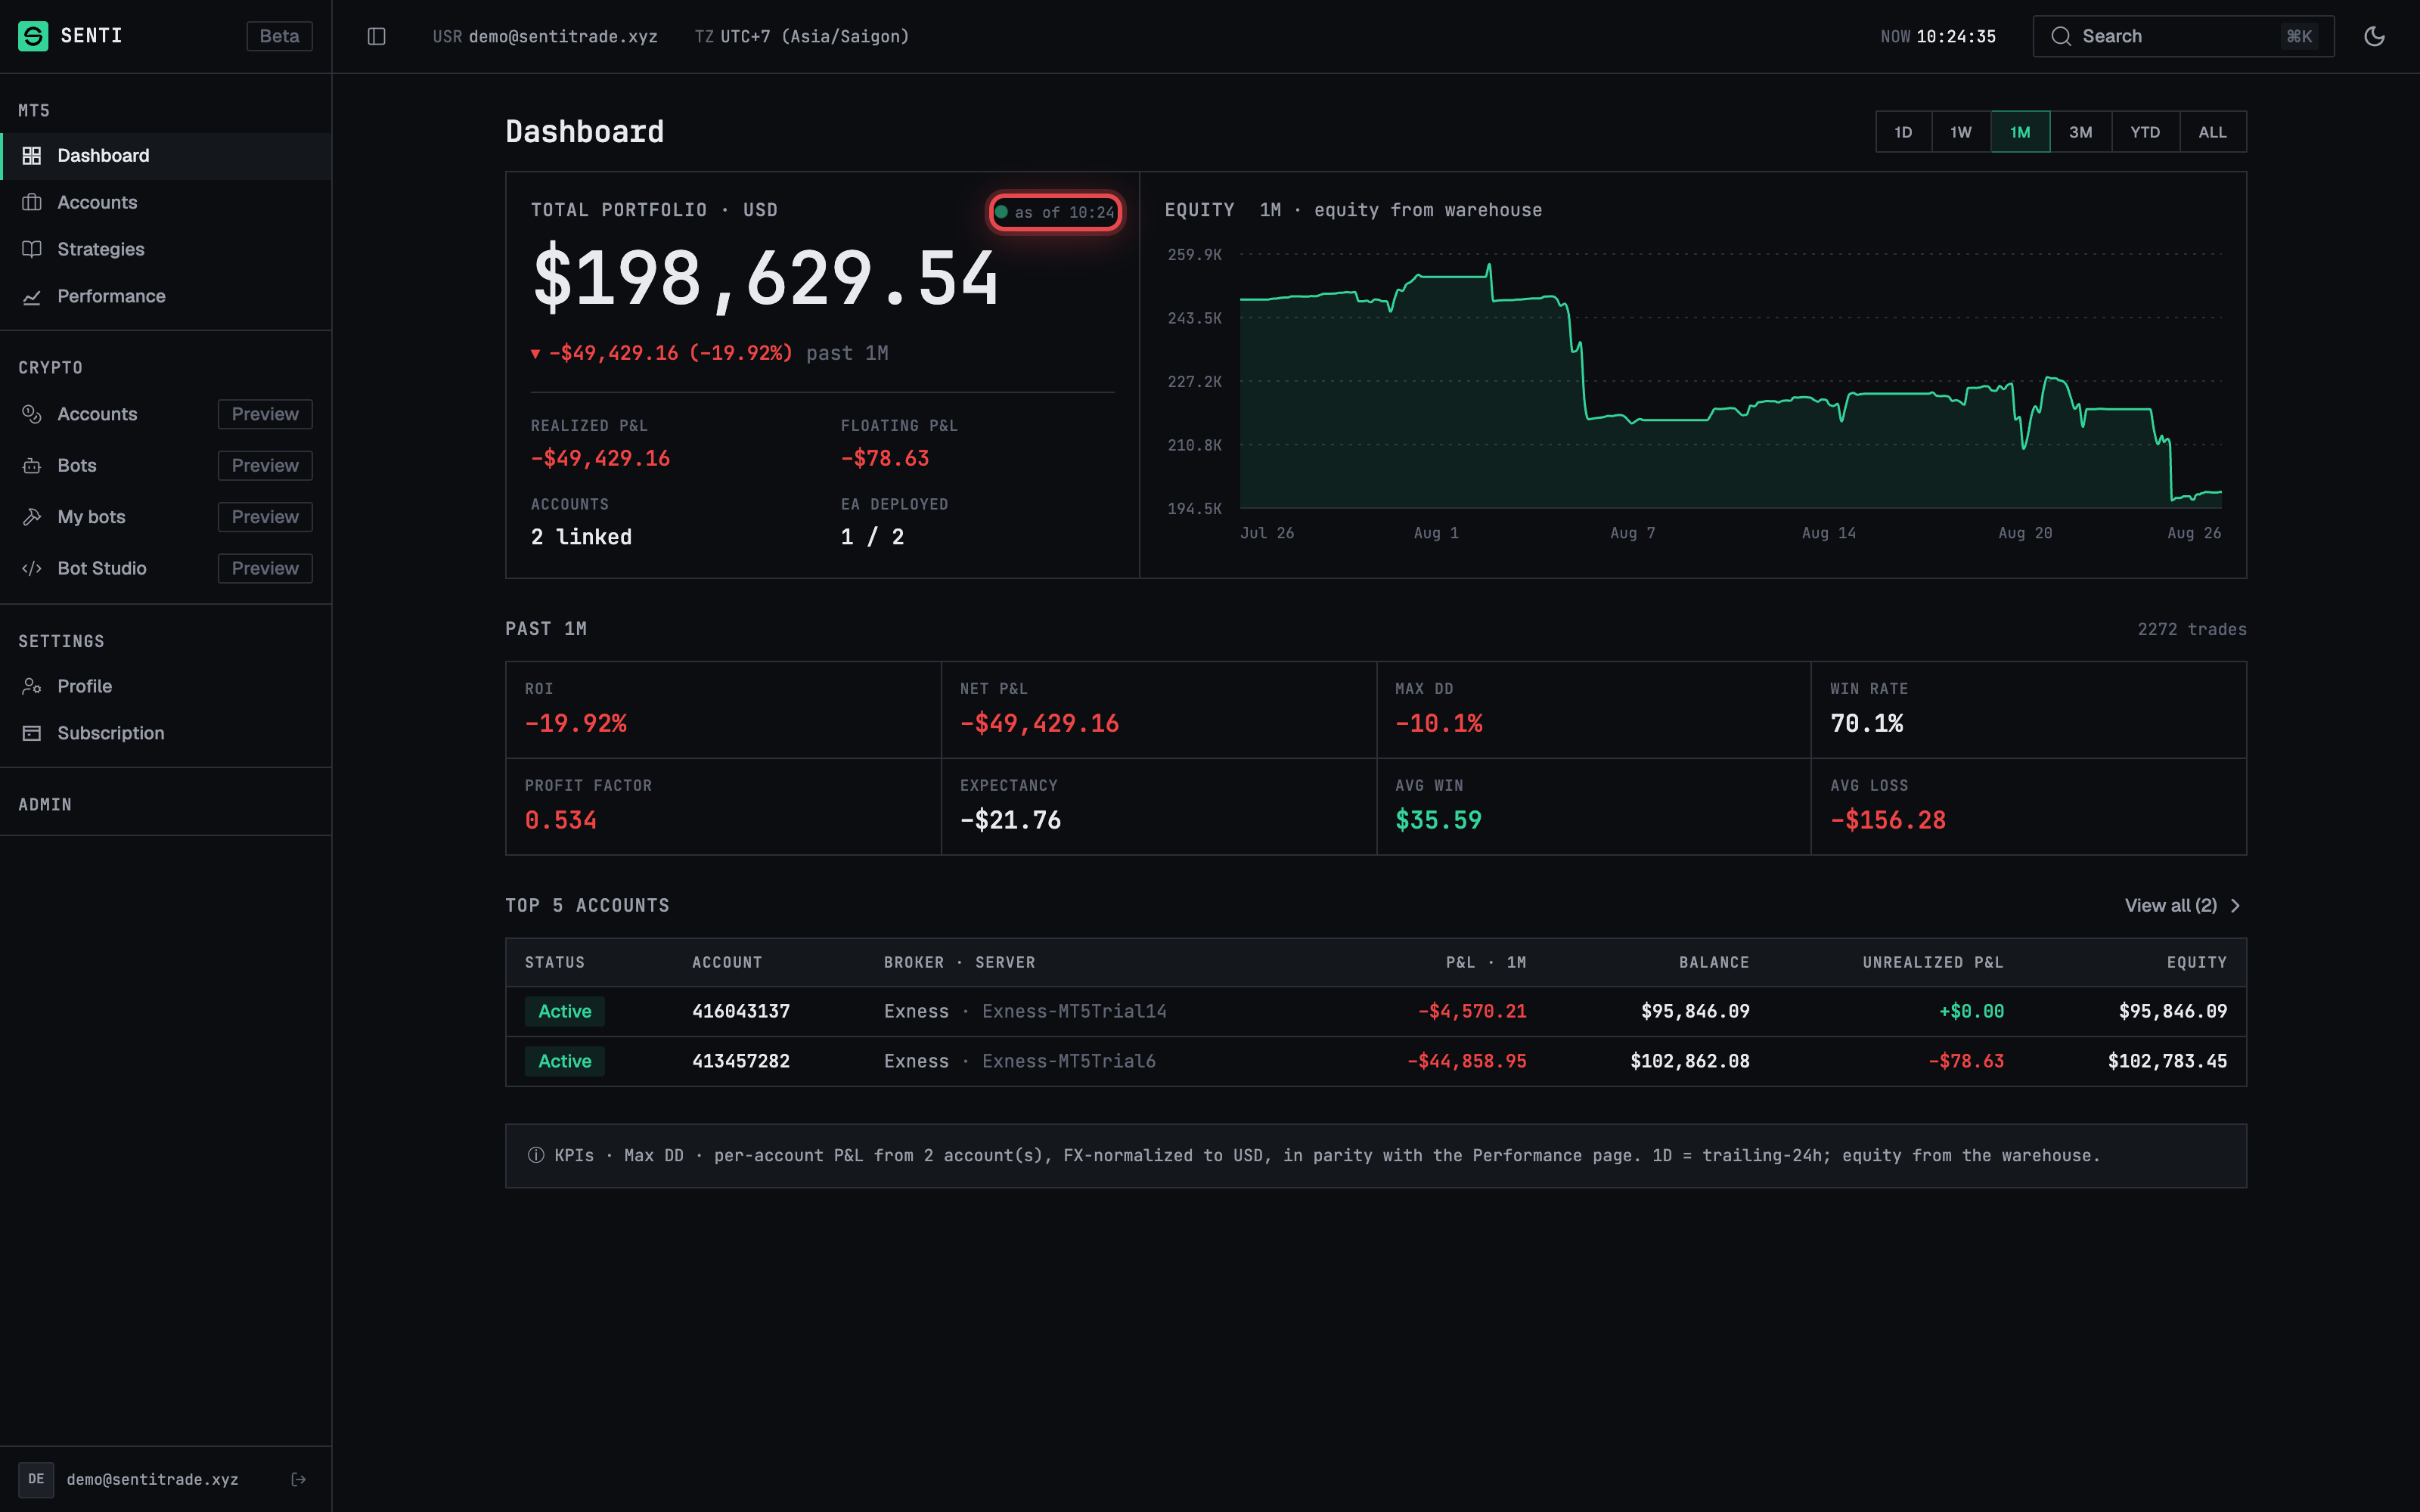
- Scan the sub-stats. The hero row also shows Realized P&L, Floating P&L, Accounts ({count} linked), and EA deployed — your one-line answer to “how much is at work, and is anything floating?”.
Read the equity curve and KPI grid
-
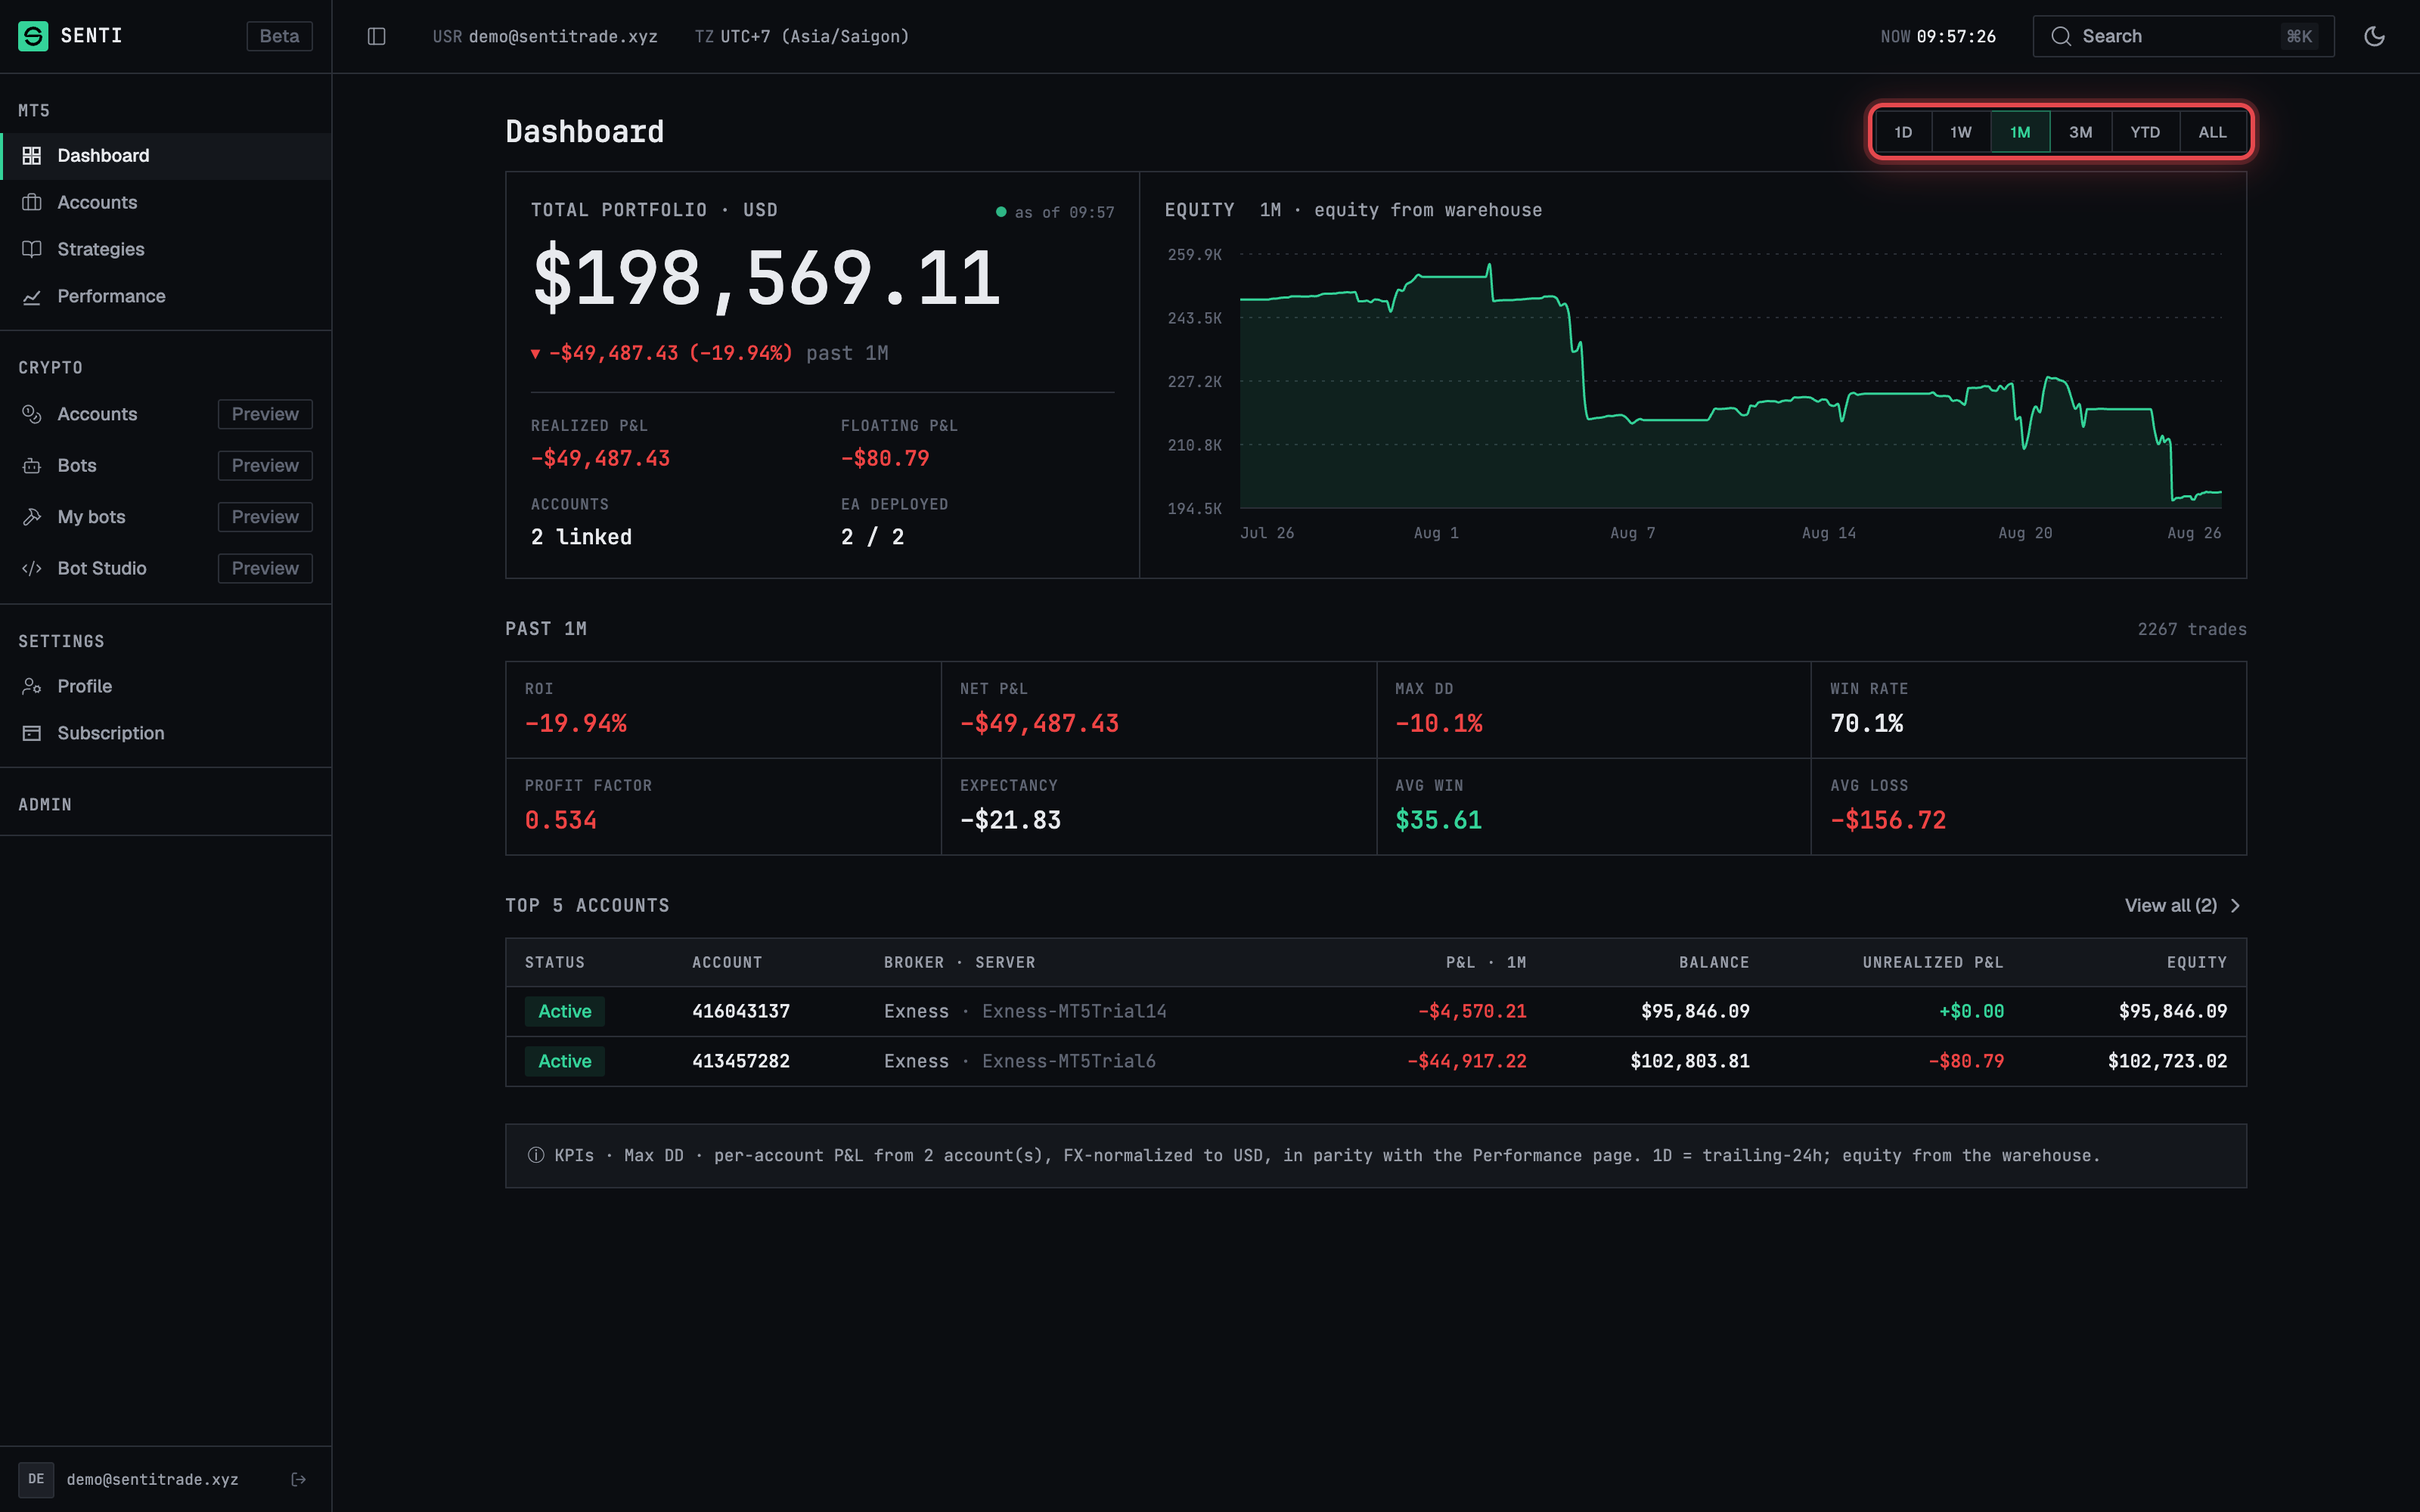
Pick a range. The equity chart has a range picker (1D · 1W · 1M · 3M · YTD · ALL). While data loads it shows loading {range} data…; an empty window shows no snapshots in range.
-
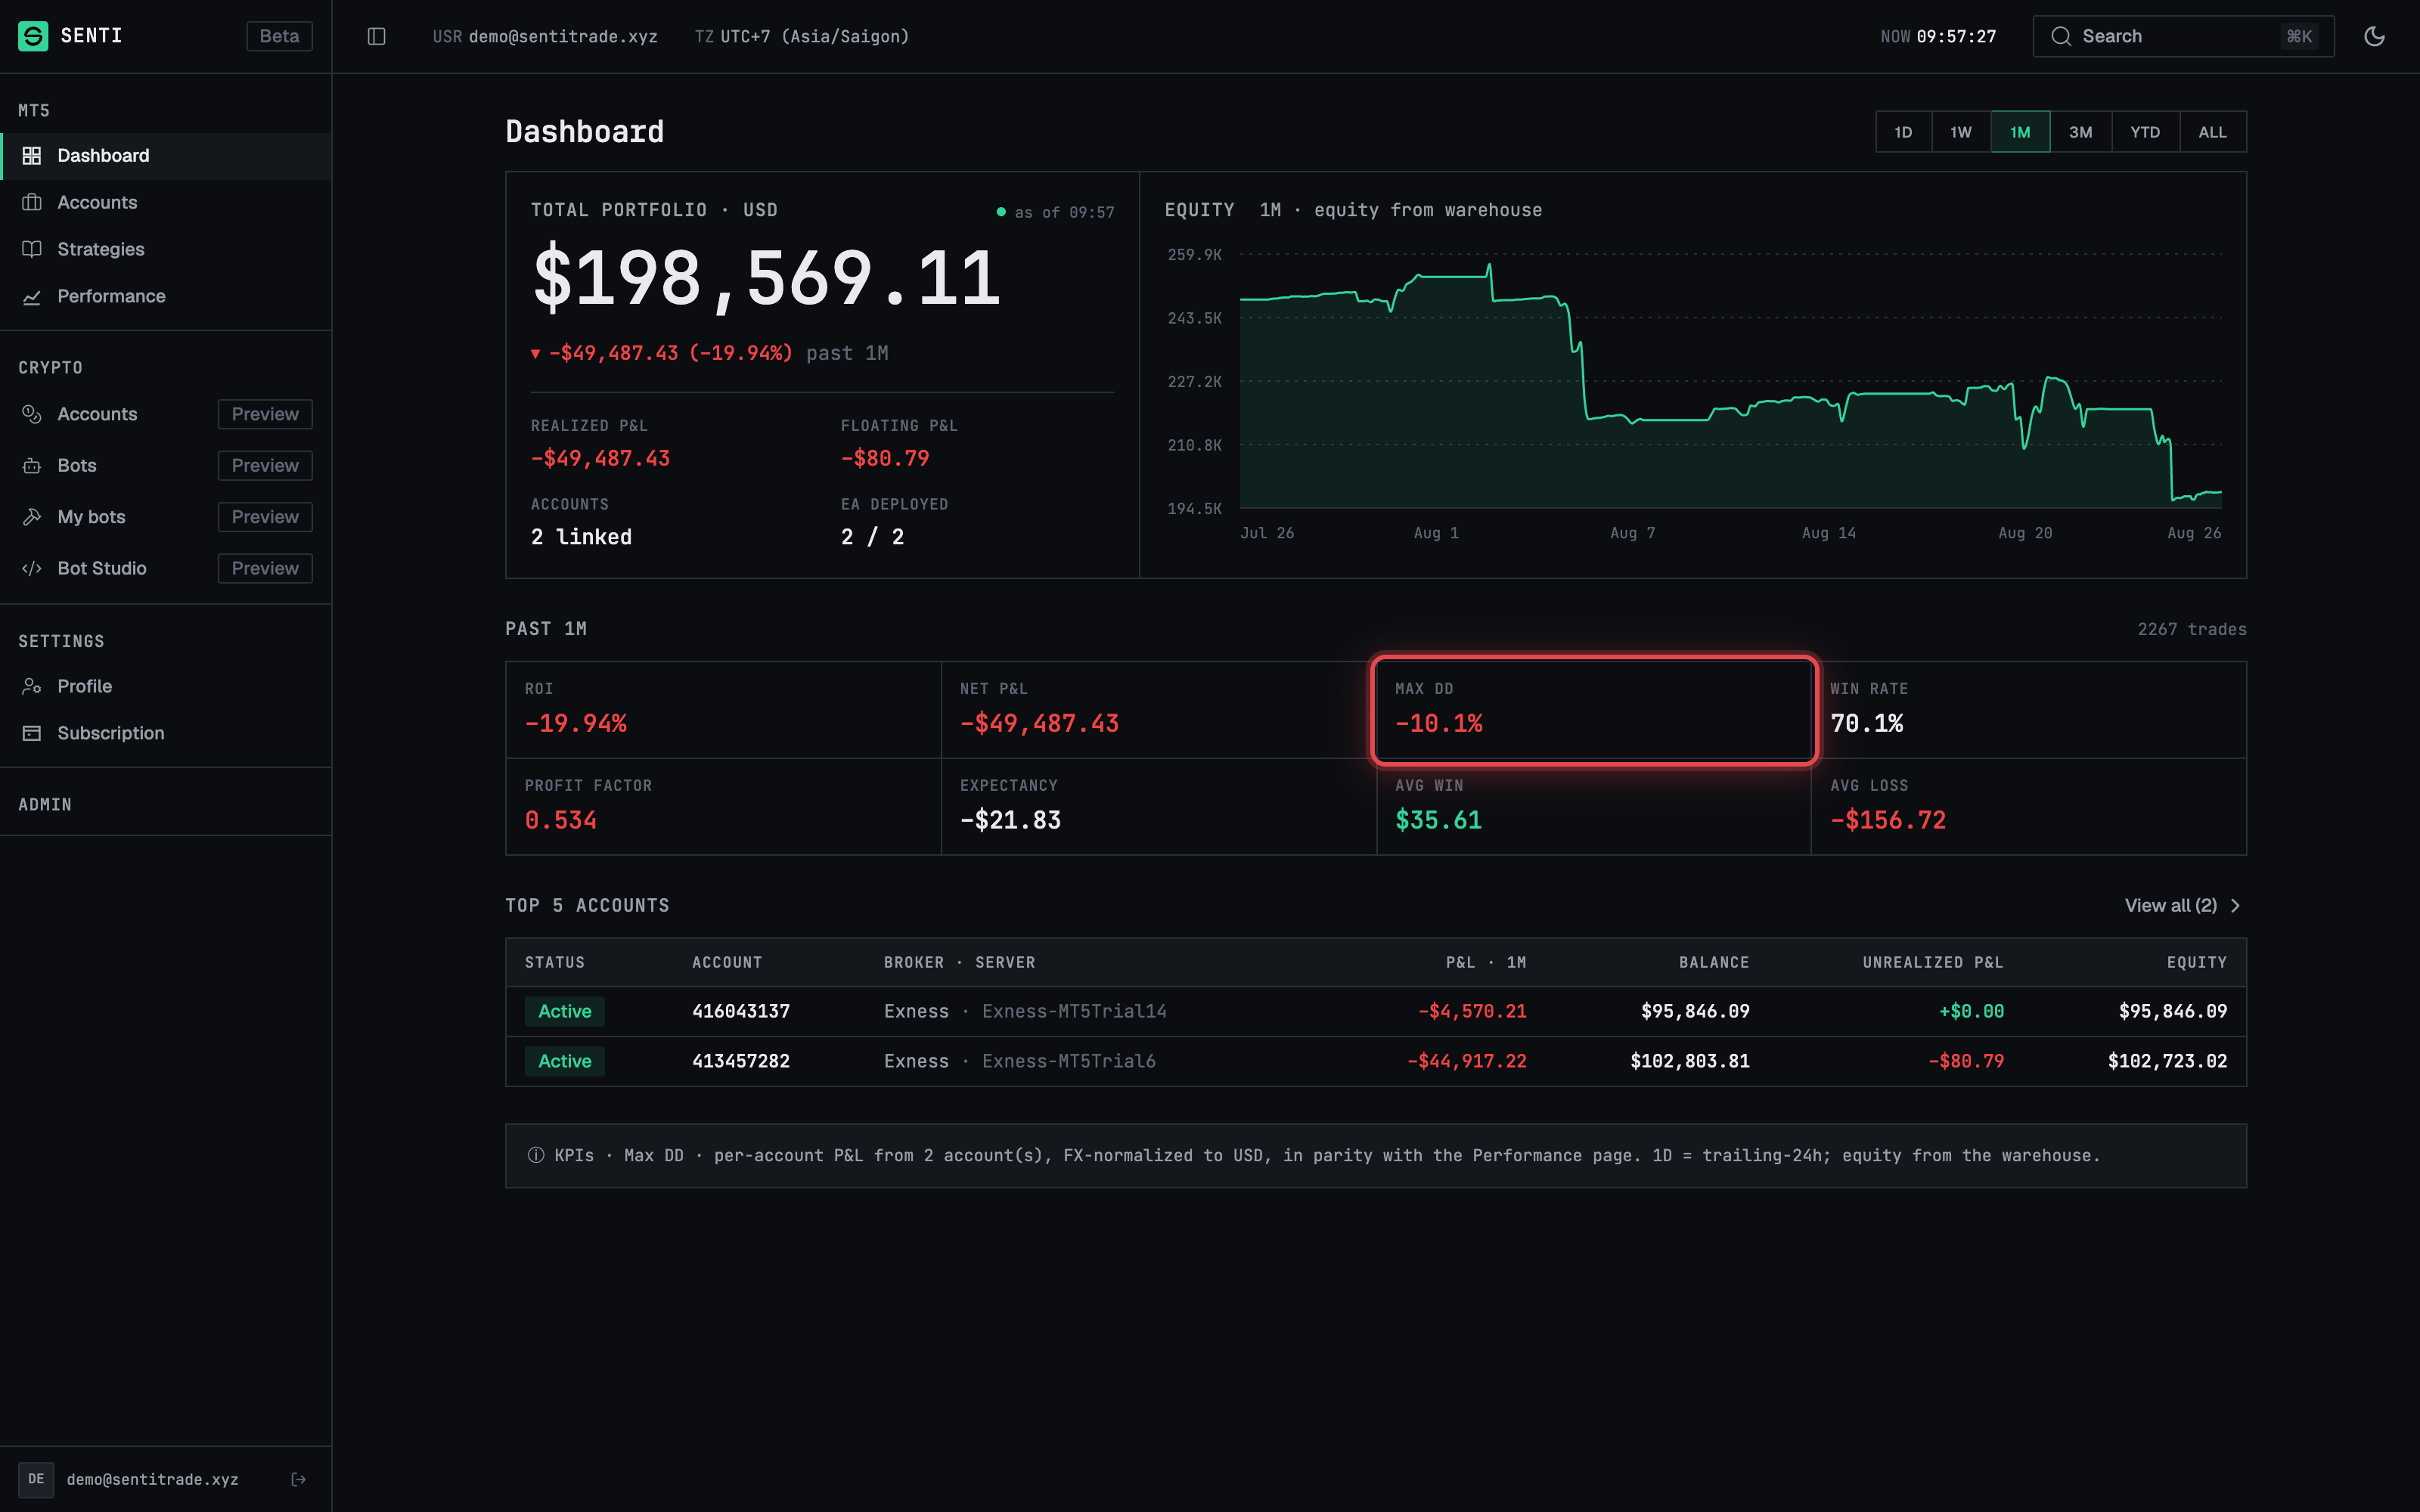
Read the KPI grid. Below the curve: ROI, Net P&L, Max DD, Win rate, Profit factor, Expectancy, Avg win, Avg loss — all computed for the selected range. A footnote explains the basis, e.g. “KPIs · Max DD · per-account P&L from N accounts, FX-normalized to USD, in parity with the Performance page. 1D = trailing-24h; equity from the warehouse.”
- Don’t panic at empty KPIs. With no closed deals in the range yet, the Dashboard says so: “No closed deals in the … range yet — KPIs and the equity curve fill in as trades close and snapshots record.”
Read the account and trading tables
-
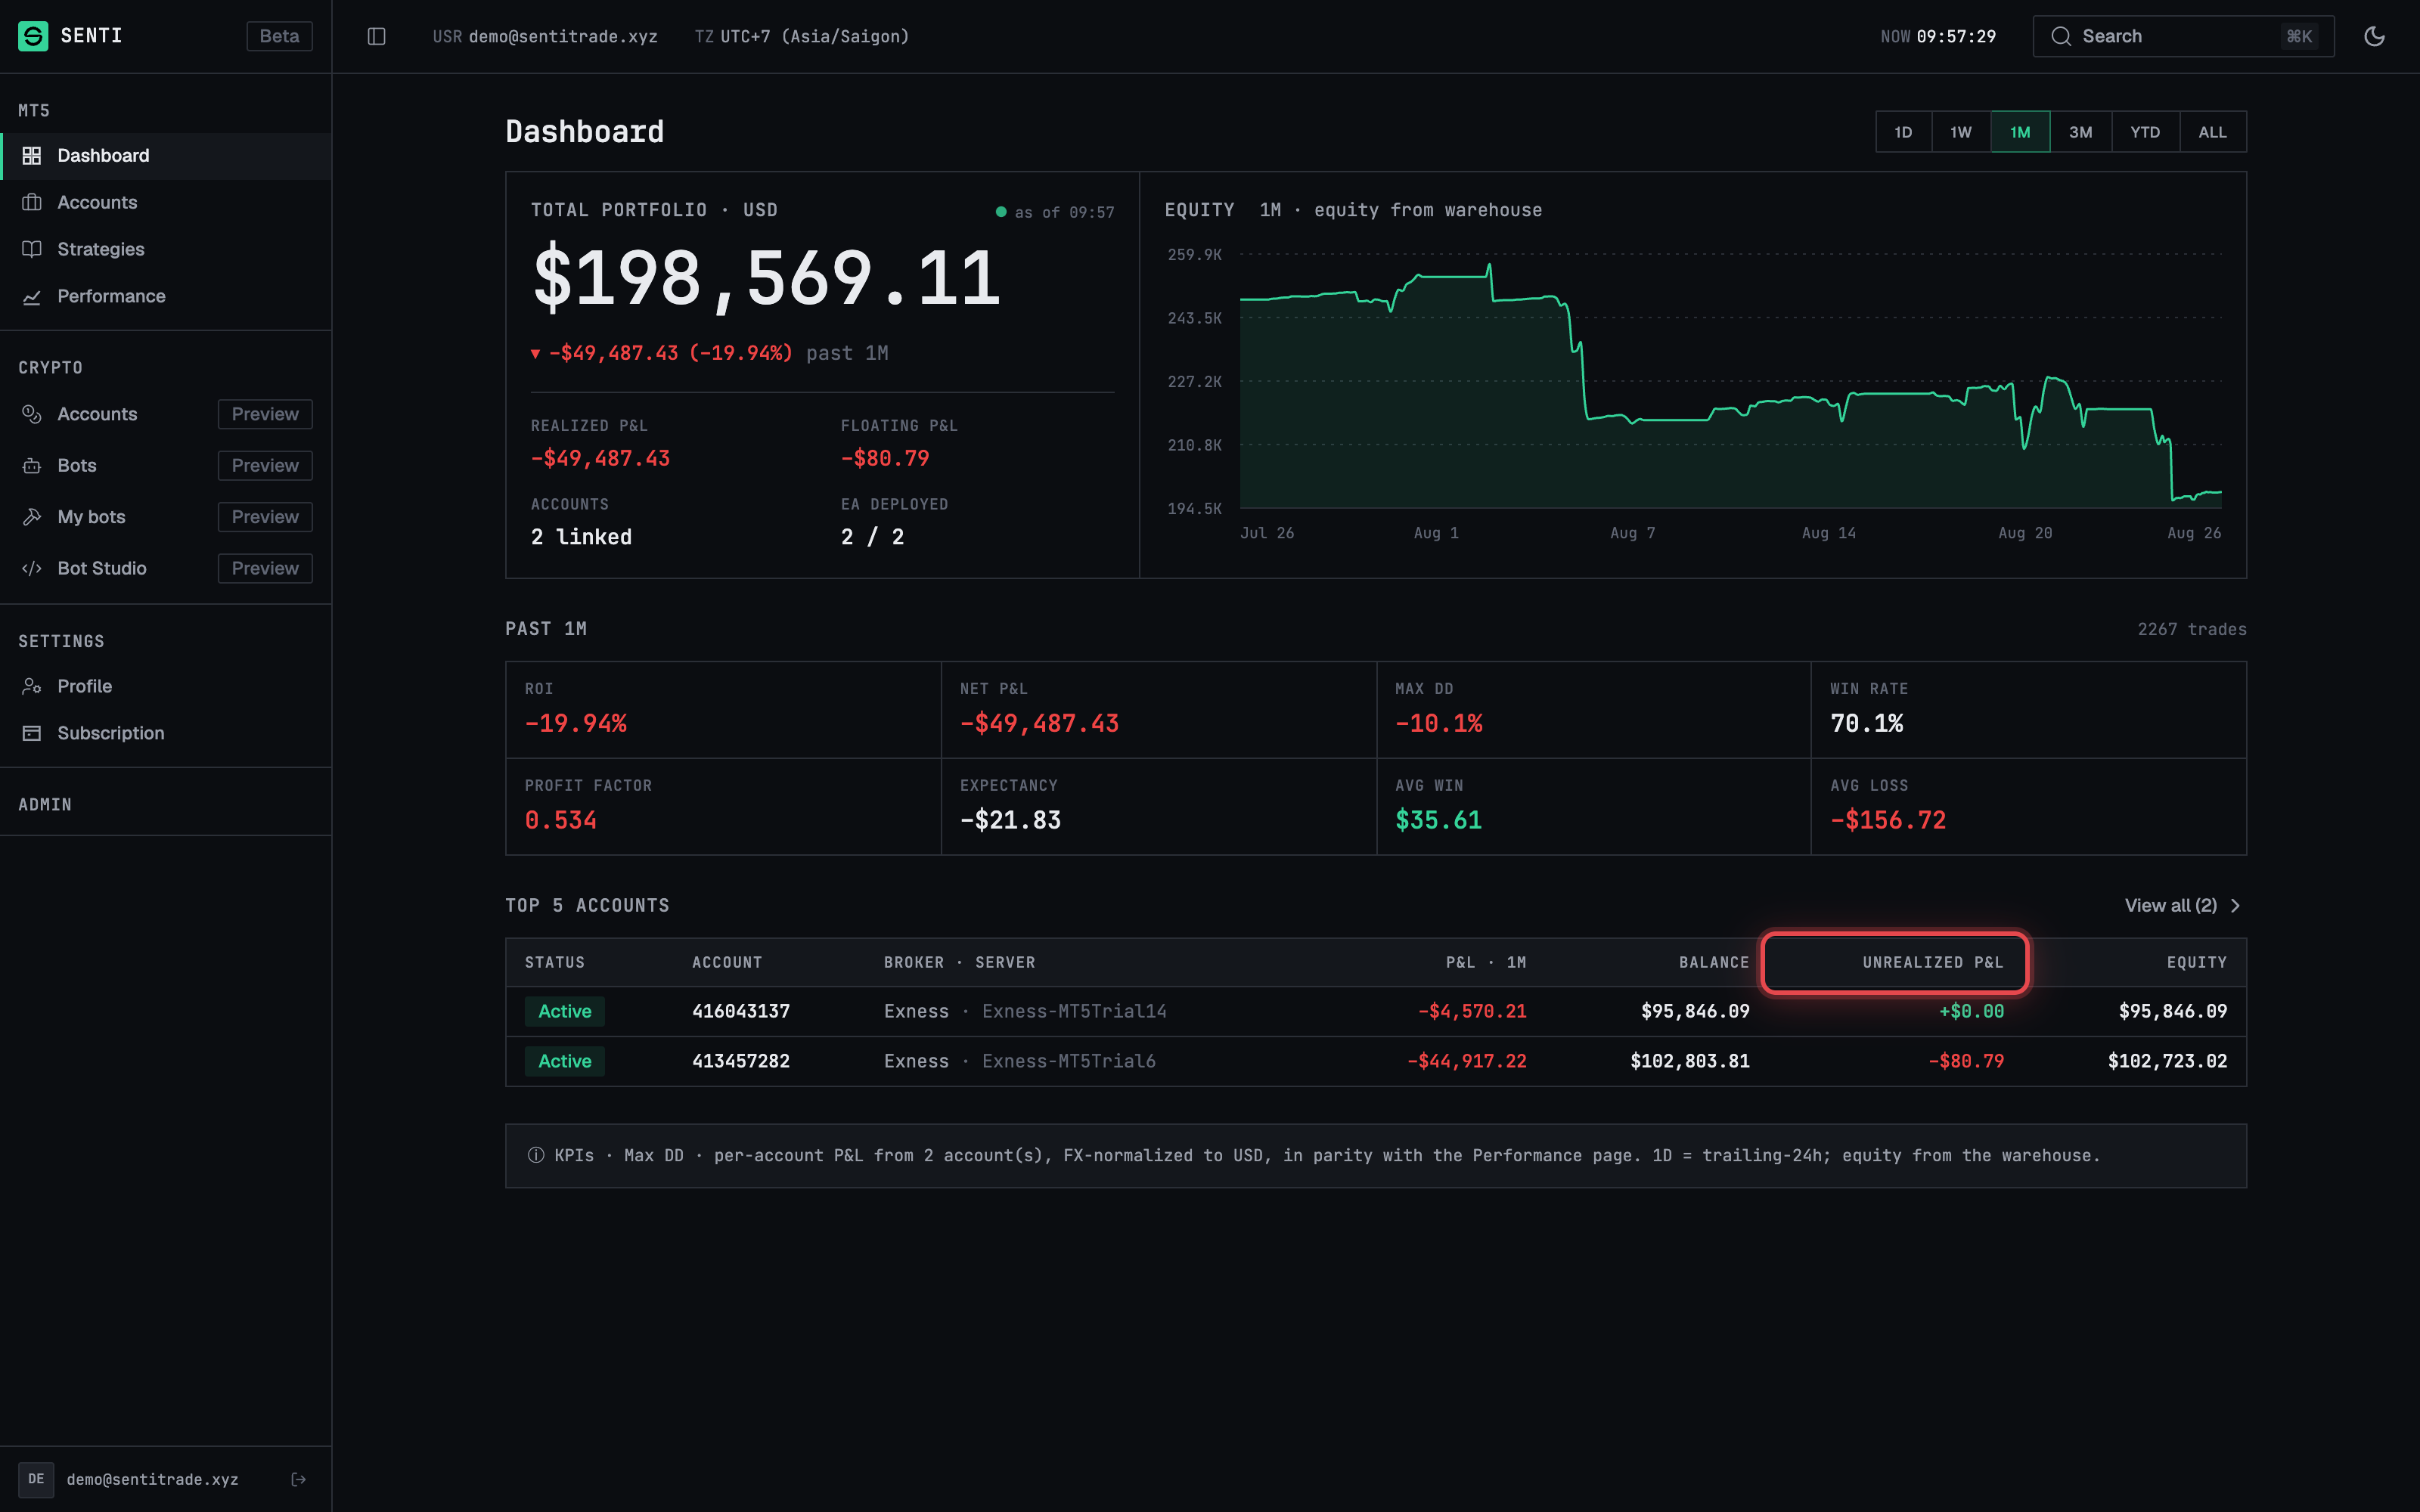
Top 5 accounts. The accounts table shows Status (Active / Error / Inactive), Account, Broker · Server, period P&L, Balance, Unrealized P&L, and Equity. Press View all ({count}) for the full Accounts list, or a row to open that account.
-
Trading activity. The trading section tabs — Positions, History, Deals — show open positions (with Magic #, Symbol, Side, Volume, open/current price, Floating P&L, Bot, and open time) and recent closed activity across accounts. An idle portfolio shows “No open positions. The bot will open positions when signal conditions are met.”
Understand the notice banners
-
Know what each banner means. The Dashboard degrades gracefully and tells you which data path is affected:
Banner Meaning “Link an MT5 account to see live data.” No accounts linked — the page has nothing to show. “Unable to load portfolio metrics from the analytics service — the equity curve and KPIs may be unavailable. The per-account snapshot still polls Kong every 30s.” The analytics backend is down; per-account balances stay live. “Unable to reach Kong gateway — showing balance from DB cache.” The live gateway is unreachable; numbers come from the database cache and may lag. “{count} accounts not currency-converted” Some accounts lack an FX rate to the reporting currency and are excluded from converted totals.
Warnings & constraints
⚠️ FX normalization is approximate. Portfolio totals are converted to the reporting currency at spot rates; accounts without a usable rate are excluded and flagged as not currency-converted. Treat cross-currency totals as an estimate, not an accounting statement — the per-account values in each account’s own currency are the ground truth.
Note. The Dashboard and the Performance page are computed to be in parity — the same accounts, FX normalization, and KPI definitions. The 1D range means trailing 24 hours, and equity history comes from the warehouse, so it can trail your terminal slightly.
- Floating P&L is unrealized — it changes with the market and is not income until positions close.
- When live data is unavailable, the historical view “may lag your terminal by up to ~5 min” — use the sync chip’s Refresh to retry.
Common errors
| Symptom | Cause | Fix |
|---|---|---|
| “Link an MT5 account to see live data.” | No MT5 account is linked | Link one — the whole Dashboard hangs off linked accounts |
| Equity curve / KPIs missing, accounts table fine | Analytics service unavailable | Wait — per-account balances keep polling; the curve returns when the service recovers |
| “Unable to reach Kong gateway — showing balance from DB cache.” | Gateway unreachable from your session | Check your network; if it persists, the platform side is degraded — values catch up on recovery |
| no snapshots in range on the equity chart | The selected range predates your history | Pick a wider range (ALL) or wait for snapshots to accumulate |
| KPIs all empty / zero | No closed deals in the selected range | Normal for a fresh account — they fill in as trades close |
| Totals look too small | Accounts excluded from conversion | Check the not currency-converted badge; excluded accounts aren’t in the converted total |
| Numbers differ from your MT5 terminal right now | Cache lag (up to ~5 min) on the historical path | Press Refresh on the sync chip, or compare against the account’s own page |